Notes and Worksheets
Below you will find the content from lessons including the notes and worksheets (source Math-Aids.com unless other wise stated)
Creating Bar Graphs Video
|
What is a Histogram? Video
|
Line Graph Video
|
*Circle Graphs are also known as Pie Charts
Pie Chart Video
| ||||||||
|
|
| ||||||
| |||
Using the bar graph WS 1 interpret the graph based on the weather statistics found in Dawson Creek.
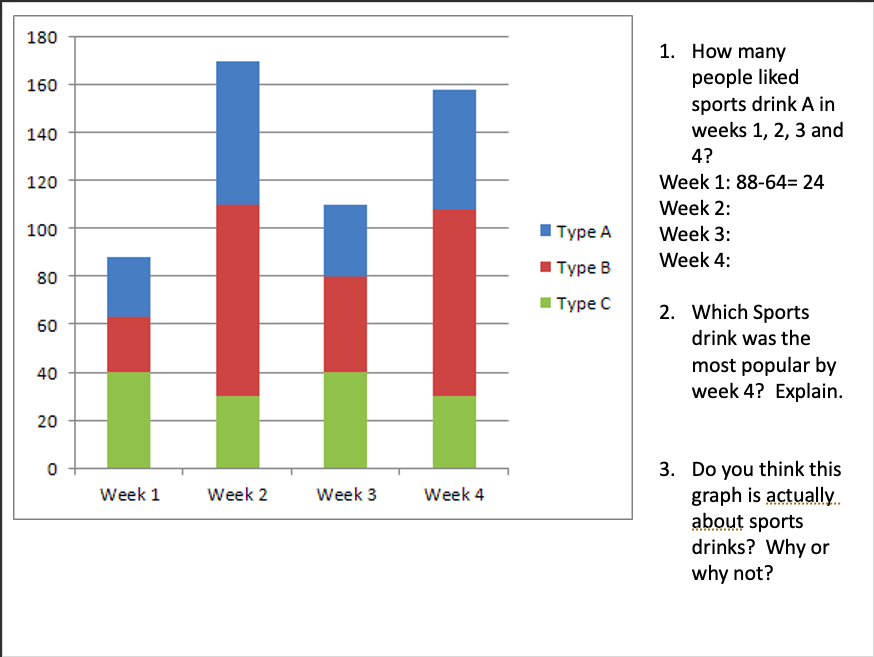
Using the bar graph WS 2 interpret stacked bar graph
|
Using the histogram WS interpret the graph based on the percentage of males that exercise based on age.
|
Using the broken line graph WS interpret the graph based on the students performance in math in various grades.
|
Using the circle graph WS interpret the graph based on the school survey results for "I can apply what I have learned in school to life outside of school"
| ||||||||||
